Article Text

Abstract
Objective Given the demand for net-zero healthcare, the carbon footprint (CF) of healthcare systems has attracted increasing interest in research in recent years. This systematic review investigates the results and methodological transparency of CF calculations of healthcare systems. The methodological emphasis lies specifically on input–output based calculations.
Design Systematic review according to the Preferred Reporting Items for Systematic Reviews and Meta-Analyses guideline.
Data sources PubMed, Web of Science, EconBiz, Scopus and Google Scholar were initially searched on 25 November 2019. Search updates in PubMed and Web of Science were considered until December 2023. The search was complemented by reference tracking within all the included studies.
Eligibility criteria We included original studies that calculated and reported the CF of one or more healthcare systems. Studies were excluded if the specific systems were not named or no information on the calculation method was provided.
Data extraction and synthesis Within the initial search, two independent reviewers searched, screened and extracted information from the included studies. A checklist was developed to extract information on results and methodology and assess the included studies’ transparency.
Results 15 studies were included. The mean ratio of healthcare system emissions to total national emissions was 4.9% (minimum 1.5%; maximum 9.8%), and CFs were growing in most countries. Hospital care led to the largest relative share of the total CF. At least 71% of the methodological items were reported by each study.
Conclusions The results of this review show that healthcare systems contribute substantially to national carbon emissions, and hospitals are one of the main contributors in this regard. They also show that mitigation measures can help reduce emissions over time. The checklist developed here can serve as a reference point to help make methodological decisions in future research reports as well as report homogeneous results.
- decision making
- health services administration & management
- change management
- international health services
- organisation of health services
Data availability statement
All data relevant to the study are included in the article or uploaded as supplementary information. Data are available upon reasonable request. The data that support the findings of this study are available in online supplemental file 4 'System description and results' and online supplemental file 5 'Methods and transparency'. Further data are available from the corresponding author (MKeil), upon reasonable request.
This is an open access article distributed in accordance with the Creative Commons Attribution Non Commercial (CC BY-NC 4.0) license, which permits others to distribute, remix, adapt, build upon this work non-commercially, and license their derivative works on different terms, provided the original work is properly cited, appropriate credit is given, any changes made indicated, and the use is non-commercial. See: http://creativecommons.org/licenses/by-nc/4.0/.
Statistics from Altmetric.com
- decision making
- health services administration & management
- change management
- international health services
- organisation of health services
STRENGTHS AND LIMITATIONS OF THIS STUDY
The assessment of methodological choices and the transparency of methods when assessing the greenhouse gas (GHG) emissions of entire sectors in systematic reviews can help deepen our understanding of the results.
The systematic review of all available evidence on GHG emissions of and within healthcare can help to understand its impact and to identify reduction potentials.
This review was limited to articles in English and German, and excluded assessments, grey literature from public reports, and reports from statistical offices published in other languages.
Introduction
Background
Climate change is one of the most pressing issues of our time.1 Considering the correlation between the gross domestic product and carbon emissions,2 the healthcare industry is likely an essential contributor to greenhouse gas (GHG) emissions. Demographic shifts and income effects have likely spurred greater demand for healthcare services, a trend projected to persist and further elevate the economic significance of the healthcare industry.3 Evidence on healthcare’s GHG emissions is needed to understand its role better.
Methods for calculating a carbon footprint (CF) can be broadly categorised into bottom-up and top-down approaches. Bottom-up methods, such as process-based lifecycle assessments, require extensive data, which currently limits their application at a sectoral level. However, the CF of various sectors can be estimated using a more uncertain top-down methodology, providing a trade-off for broader coverage. In this case, emissions are divided according to the final demand or economic sectors of emission occurrence.
Input–output (I–O) analysis, which follows this approach, can be used to estimate sectoral CF.4 Calculations of the CF use the static open-quantity I–O model in combination with an environmental extension. They rely on two fundamental building blocks: an I–O table and a demand vector. The I–O table describes the interactions between the sectors of production, often in monetary terms, and are usually constructed by national statistics offices. With additional information on their environmental impact, the emission intensity of a sector and its upstream production processes can be calculated. The demand vector represents the expenditures of the relevant sectors. For example, the demand vector of the healthcare sector includes expenditure on diesel fuel to power ambulances, electricity consumed by hospitals, and all other forms of energy. It may be necessary to synchronise the structures of the I–O table and the demand vector by balancing the definitions of different sectors and adjusting the level of sectoral aggregation.
I–O models can be grouped into single-region I–O (SRIO) and multi-region I–O (MRIO) models. SRIO models use I–O data from a single country, thus restricting their scope to domestic production and emissions only. MRIO models connect multiple I–O tables from multiple countries, and can thus account for different levels of production and ‘trade’ in emissions (ie, emissions occurring in one country related to the final demand of another country). The need for synchronised data from multiple countries complicates the development and update of the data of MRIO models.
The results of CF calculations for a specific sector can be influenced by methodological choices, including the selection between SRIO or MRIO models and the GHGs taken into account. Therefore, comprehensive reporting is needed to ensure the transparency of methodological choices, the data and the results. However, our search of the literature yielded neither a standardised procedure nor standardised reporting.
Objective
The aim of this study is to conduct a systematic review of research using I–O analysis to quantify the CF of systems, encompassing total CF, CF per capita, and its proportion relative to the national CF. Furthermore, data on emission trends over time, can deepen the understanding of the trajectory of the CF of healthcare systems. Finally, an assessment of the methodological choices and their transparency within the reviewed studies can help to discuss the state of the methodology and provides a foundation to discuss methodological differences between the studies.
Methods
Search strategy and selection criteria
This systematic review was performed by following the Preferred Reporting Items for Systematic Reviews and Meta-Analyses guidelines5 (the checklist is provided in online supplemental file 1). The databases PubMed, Web of Science, EconBiz, Scopus and Google Scholar were searched for studies on 25 November 2019. The full search strategy is provided in online supplemental file 2. The search was complemented by reference tracking within all the included studies. The updated search considered hits in PubMed and Web of Science up to December 2023.
Supplemental material
Supplemental material
Following the screening of the titles and abstracts, studies were included for further investigation if they had (1) addressed the method of CF calculation, (2) addressed one or more healthcare systems or subsystems and (3) been written in English or German. A healthcare system was defined as the national healthcare system, federal system and/or state system. Single entities, such as individual hospitals, and specialised branches, such as dentistry, were excluded. In addition to the criteria used for screening the titles and abstracts of articles, full-text articles were excluded if they (1) did not name the specific healthcare (sub)system, (2) did not calculate the CF or (3) did not provide any information on the method of calculation used. In the initial search, two of the authors separately screened titles and abstracts, read the full text, extracted data and assessed the transparency. In the case of disagreement, decisions were made through discussion until a consensus was reached. During the search update these steps were conducted by one person.
Data extraction and analysis
The CF per capita, the contribution of healthcare to the country’s total CF emissions, and the origins of emissions were used as main results of the studies. The breakdown of the emission sources could be in scopes, demand categories or places of origin. The Greenhouse Gas Protocol Corporate Accounting and Reporting Standard6 proposes three standardised scopes. Scope 1 represents direct emissions from owned or controlled sources, scope 2 represents indirect emissions generated by the purchased energy and scope 3 represents all indirect emissions that occur in the value chain. The categories of demand included the classes of expenditures of the demand vector, and the places of the origin of emissions were divided into hospitals, ambulatory services and so on.
In addition to evaluating their general characteristics and results, we developed and applied a checklist to assess the methodological transparency of the studies under consideration. We opted to use the term ‘transparency’ rather than ‘quality’ to address the issue that even a flawless study could receive a low score if the authors failed to adequately report their methodology. The checklist served as both a qualitative extraction tool and a quantitative transparency tool. The qualitative extraction tool facilitated the assessment of information from each included study, with responses to each criterion collected accordingly. As a quantitative transparency tool, it was evaluated whether the criteria were adequately addressed. When information was provided, the criterion was considered fulfilled, resulting in an increase in the transparency score. All criteria were weighted equally, therefore for each ‘fulfilled’ criterion one point was added to the transparency score, with a maximum of 17 points per study.
The utilisation of I–O data can introduce uncertainties into the assessment, given that the top-down approach relies on aggregated information from industrial sectors. When heterogeneous products with varying emission intensities are grouped into one industry, aggregation errors might occur: the average emission intensity of the aggregated industry would not appropriately reflect the emissions caused by the specific product within the industry.7 Therefore, information on the extend of usage of I–O method (criterion 5), and the number of industry sectors (criterion 12) could help to understand the scope of this uncertainty.
The choice between MRIO and SRIO (criterion 11) can also help to understand the level of uncertainty. While MRIOs can account for differences between countries and trade between these countries, SRIO might provide a more detailed framework of the domestic economy. Finally, the specific source of the I–O tables (criterion 9) and emission data (criterion 13) can help the reader to assess the quality of the used data.
Similar to the I–O data, the level of aggregation within the demand data can impact the accuracy of the results. The number of demand or expenditure categories (criterion 8) can indicate on the level of aggregation and the source of demand data (criterion 6) could help to assess the quality of the data source. The quality of the outcomes is also influenced by the alignment between the temporal representativeness of the demand data (criterion 7) and the I–O data (criterion 10). Changes over time (eg, in technology, import and exports) can impact the results and in the best case both data sources refer to the same year. Finally, information on the matching process of demand categories and industry sectors, the publication of the concordance matrix (criterion 15), increases transparency for the reader.
The quantitative (criterion 16) and qualitative (criterion 17) assessment of uncertainty helps the readers to contextualise the results. A list of the included GHGs can indicate the scope of the study, in this case 0.5 were given, when the unit (typically CO2 equivalents (CO2eq)) was mentioned and another 0.5 points if all included GHGs were listed. For the final transparency checklist, the criteria on outcomes (table 1A) and on methodology (table 1B) were combined. A more detailed description of the transparency criteria are provided in online supplemental file 3.
Supplemental material
(A) Extracted outcomes. (B) Extracted methodological items
Emissions over time
To assess trends in GHG emissions of healthcare, data from all studies that reported total emissions for more than 1 year were taken. The data were normalised to the respective starting point of the report as a base year. Therefore, GHG emissions of time period t were divided by the GHG emissions of the base year t0 and used in a descriptive analysis.
Patient and public involvement
None.
Results
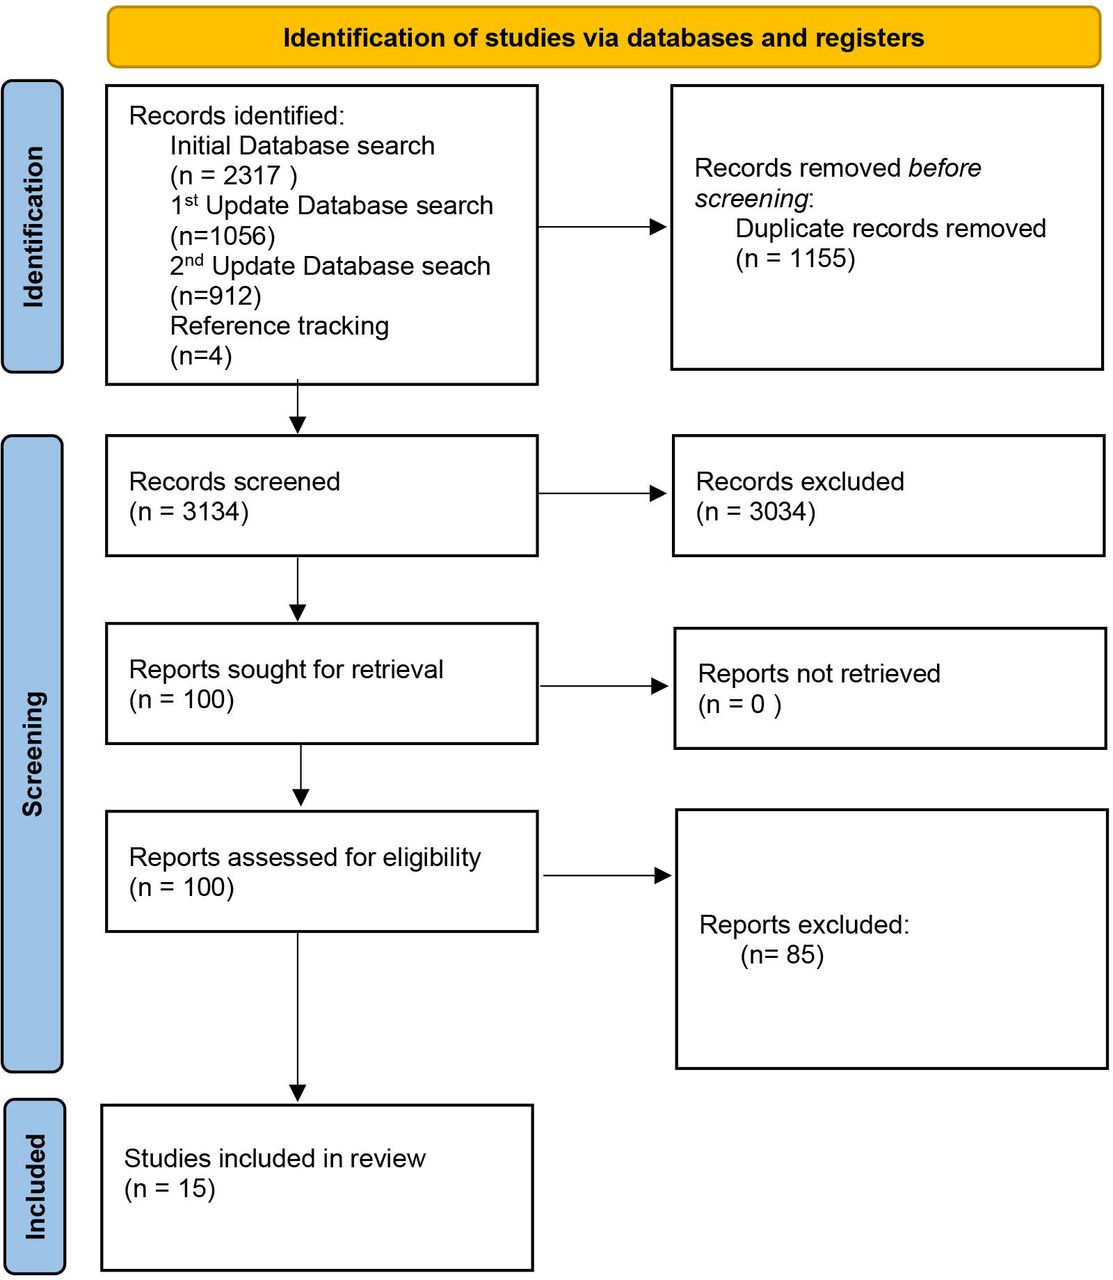
A total of 4285 records were identified in the three searches (figure 1). After removing duplicates and searching for eligible title, abstracts and full texts, 15 reports were included in this review (figure 1). A summary of included studies is provided in table 2. The detailed results of the data collection are listed in online supplemental files 4 and 5.
Supplemental material
Supplemental material

Preferred Reporting Items for Systematic Reviews and Meta-Analyses flow diagram, based on Page et al.5
Characteristics and main results of the studies considered in this review
Characteristics of the studies considered
Eleven studies focused on a single national healthcare system, including England,8 9 Japan,10 USA,11 12 Canada,13 Scotland,14 China,15 Australia,16 Austria17 and the Netherlands.18 The series of CFs from the Sustainable Development Unit of the English NHS was aggregated, and only the newest available report was cited. One study examined the healthcare system of the largest Australian state, New South Wales,19 while three studies reported on healthcare systems in multiple countries. Pichler et al20 reported results for 36 countries, Healthcare without Harm for 43 countries,21 and the investigation by Lenzen et al22 considered 189 countries.
Excluding the one that assessed the Scottish NHS, all studies were published after 2016. However, it is worth noting that the year of the analysis could be older. For instance, the study by Nansai et al10 was published in 2020 but used demand data from 2011.
Differences in methodology and data
Eleven studies considered top-down data on emissions, while three studies employed bottom-up data on energy usage.8 9 14 Steenmeijer et al18 incorporated bottom-up data regarding the quantities of anaesthetic gases, inhalers and travel.
Most single-country studies used SRIO data from the respective governmental offices. In contrast, the studies on British and Dutch healthcare, and those that considered more than one country, used MRIO data. Additionally, Malik et al23 used MRIO data, however, the database only included data from Australian regions. The EORA database emerged as the most frequently used MRIO database (three times), with one study each employing the WIOD database, the EXIOBASE database and the MRIO database provided by the British Department for the Environment, Food, and Rural Affairs.
The number of production sectors varied among the SRIO studies, ranging from 46 to 405 sectors. The MRIO studies typically used more extensive databases comprising approximately 15 000 sectors, although the MRIO study focusing on the UK considered 424 sectors.
All studies considered CO2 emissions. However, only five studies considered the six GHGs covered in the Kyoto Protocol; three studies considered CO2, methane and nitrous oxide; two reported only that they had used CO2eq as unit; and two studies did not report any included GHG or the unit in which the outcomes were reported. The data on emissions were drawn mostly from national accounts in the case of SRIO databases and integrated accounts in the case of MRIO databases. One study did not report the source of its emission account data.
The demand data was taken either from official health expenditure accounts or from international organisations such as the WHO and the World Bank (which uses data provided by national offices and accounts). Lenzen et al22 identified and directly used data on healthcare-related sectors from the MRIO database EORA. The number of reported expenditure accounts varied, mostly ranging from 13 to 19, although three studies reported fewer accounts. Weisz et al17 used nine accounts, Wu15 used eight accounts, and the study on the NHS in England employed five accounts.9 Due to the distinct methodologies employed by Lenzen et al22 and the structure of the EORA database, which reports country-specific sectors, they used 163 sectors from the EORA as demand data.
The time periods covered by the demand data were largely consistent with those covered by the respective I–O data. Some studies reporting outcomes for more than 1 year only used one reference year for the I–O database and adjusted the demand data for inflation.11–13 The lag between the time at which the data were collected and the time of publication of the corresponding study ranged from 3 to 6 years, with deviations in the studies by Nansai et al,10 Eckelman et al12 (2 years) and in the report by the SDU.9 The latter reported the CF periodically; the lag between the latest publication and the latest data was 1 year.9 Further information on this is provided in online supplemental file 5.
Five studies provided their concordance matrices, which link the categories of demand with the industrial sectors. The authors of one study had made their matrix available on request, and two articles had referred to a matrix previously used in another study. Five studies did not report their concordance matrices.
Reporting of the results
The origins of emissions were documented six times in the three scopes defined by the GHG protocol. Emission sources were reported eight times in the (sub)categories of final demand, such as hospitals or pharmaceuticals. Two studies reported the economic sector in which the emissions occurred, for example, the textile sector or the manufacture of fuels. Furthermore, three studies reported a breakdown of emissions by employing more than one reporting structure. Several differences were observed in the scopes of the reported results. Some studies directly referenced the GHG protocol while others reported emissions in divisions, such as travel, energy, procurement, etc. 47% of the articles did not normalise the results by reporting the CF per capita.
Overall transparency
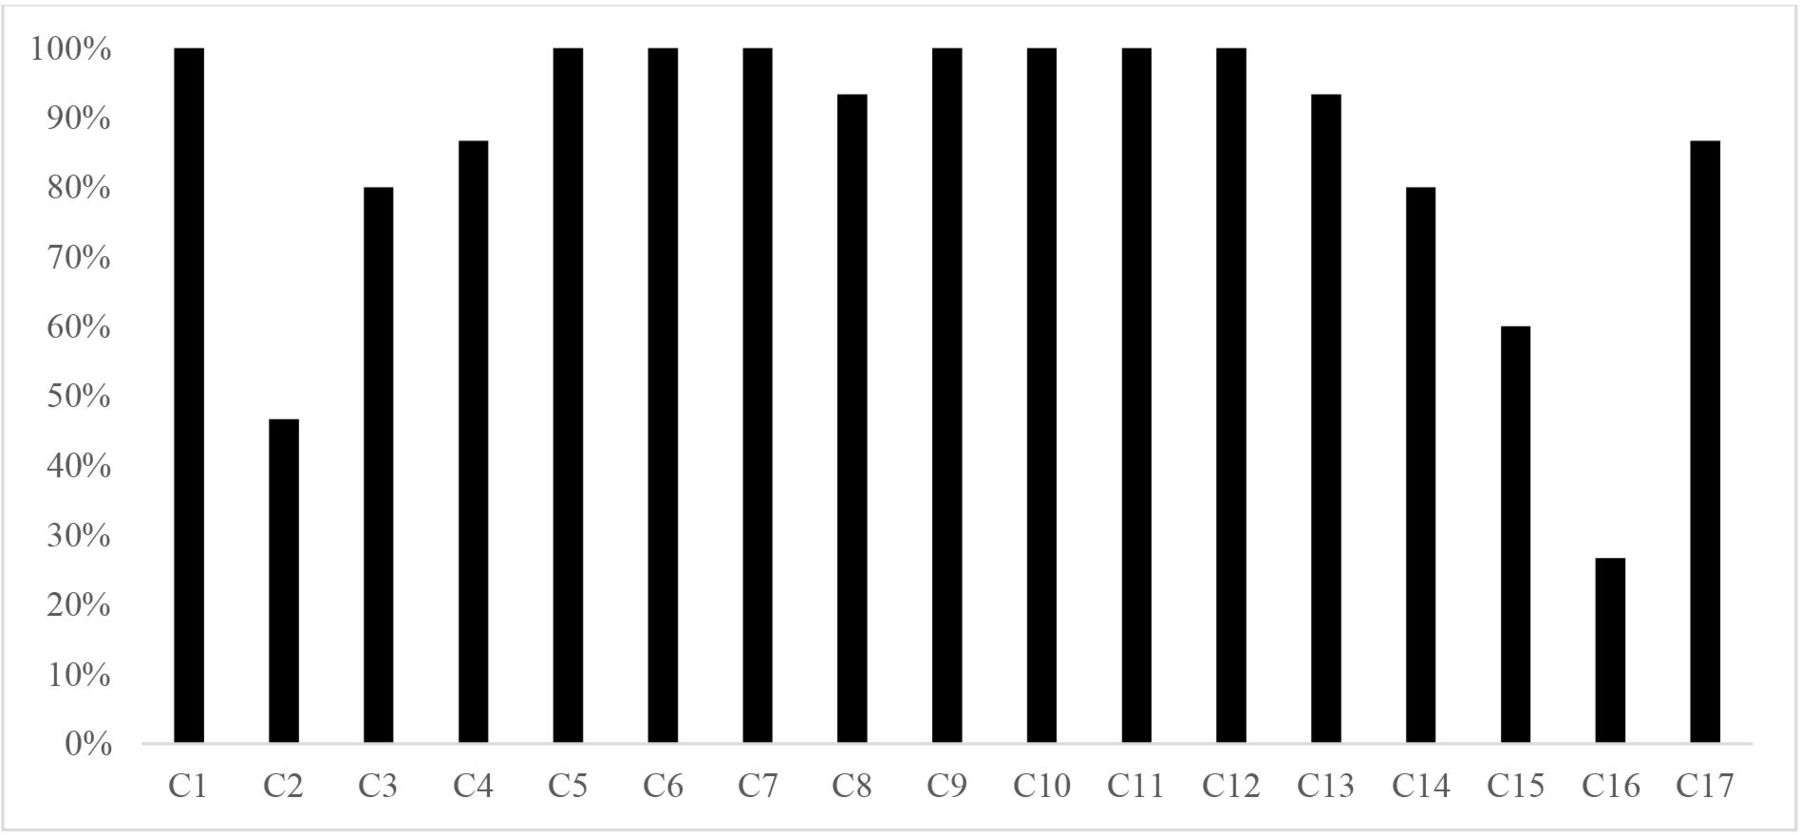
Except for the three criteria ‘reporting of the concordance matrix’, ‘uncertainty analysis’ and ‘CF per capita’, all criteria were fulfilled by at least 75% of the studies (figure 2). The studies fulfilled between 70.5% and 94% of all criteria with a mean of 85% (figure 3). The full transparency assessment is provided in online supplemental file 6.
Supplemental material

Fulfilment rate of the transparency and reporting criteria.

Transparency score in percentage per article.
Outcomes
Emissions over time
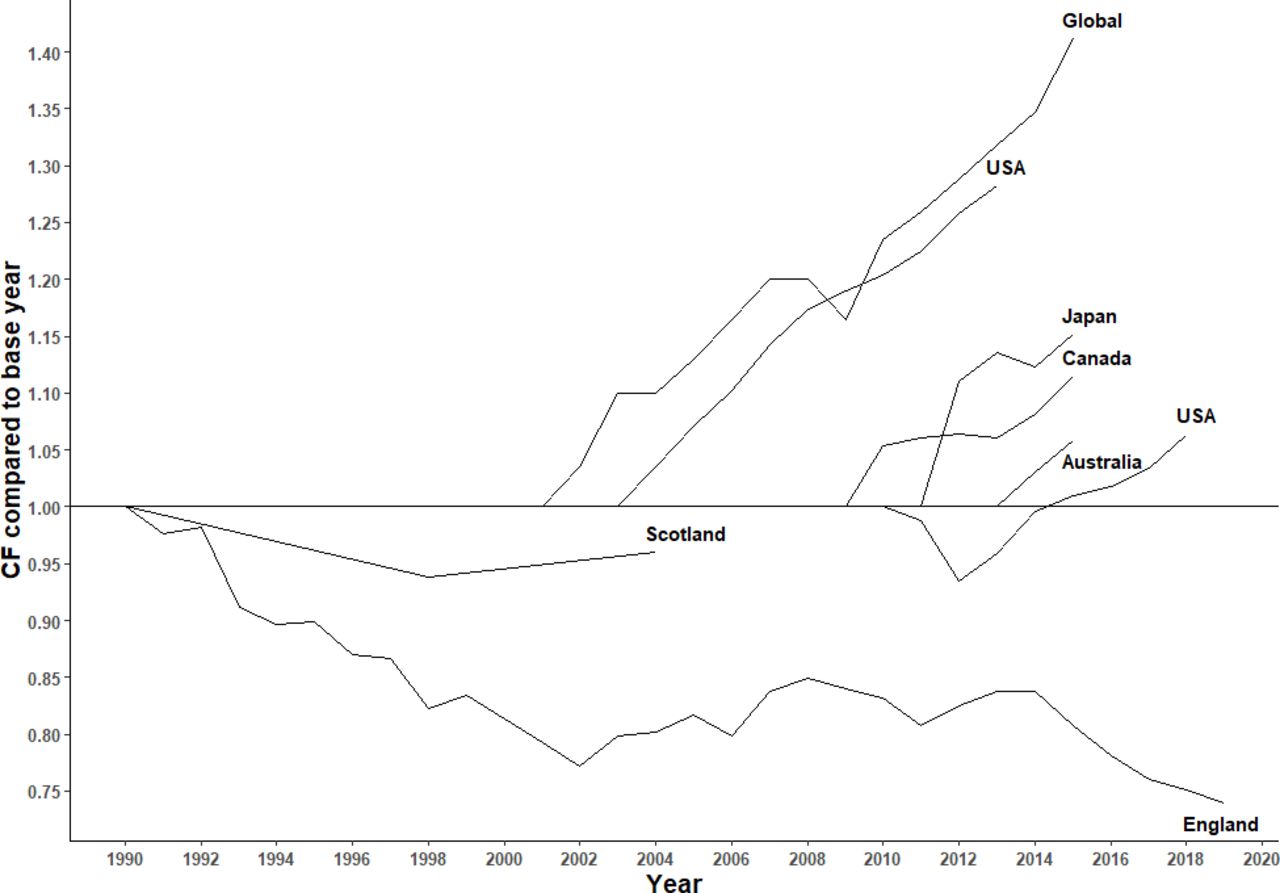
The results of the time series revealed successful efforts to mitigate the CF by the NHS in England and Scotland (figure 4). In the nearly three decades from 1990 to 2019, the English NHS reduced its CF by roughly 25%. The four remaining countries (Japan, Canada, USA and Australia) examined in the studies considered here and the global trend showed increased CF due to healthcare (figure 4). The annual increase in the CF ranged from 0.7% (USA, 2010–2018) to 3.8% (Japan, 2011–2015) over the observed period, with the CFs of Canada (1.9%, 2009–2015), USA (2.8%, 2011–2015) and Australia (2.9%, 2013–2015) in between these extremes. The global trend showed an increase in the CF of 2.7% per year from 2000 to 2015.

Emission trends over time. CF, carbon footprint.
Breakdown
The emission sources were mainly reported using the scope system from the GHG protocol or the categories of expenditure, that is, the categories of final demand. The largest dataset that used the categories of final demand was provided by Pichler et al,20 who applied this to 36 countries and reported the average values. Medical retail (ie, provider of healthcare products without medical services, eg, pharmacies), hospitals and ambulatory healthcare services constituted 80% of the CF of healthcare, with medical retail contributing 33.1%, hospitals 28.6% and ambulatory healthcare services 18%. They also made a major contribution to the CF in Japan (hospitals, 25.1%; ambulatory services, 22.7%), USA in 2013 (hospital care, 36%; physician and clinical services, 12%)11 and in 2018 (hospital care, 34.9%; physician and clinical services, 12.6%; ambulatory medical services, 4.8%),13 Australia (public hospitals, 34.4%; private hospitals, 10.2%; ambulatory medical services, 15%),16 China (public hospitals, 47%; private hospitals, 4%)15 and Austria (hospitals, 32%; ambulatory services, 18%).17 Other important categories of emissions were construction and pharmaceutical products, at around 10%,11 16 20 with a higher share in China (pharmaceuticals, 18%; construction, 15%).15
An alternative approach involved categorising emissions into direct emissions, indirect emissions through electricity production, and other indirect emissions. This division along these lines could also align with the three GHG protocol scopes.
By averaging data from 43 countries, HCWH reported a distribution of 17% for scope 1 emissions, 12% for scope 2 emissions and 71% for scope 3 emissions.21 These findings, particularly the significance of scope 3 emissions, are corroborated by evidence from single-country studies.8 11 12 14 24 The scope 3 emissions were further divided into those due to travel (patient and visitor travel, and staff commutes), production of pharmaceuticals, and medical instruments and equipment, which accounted for the largest share of scope 3 emissions.
Scotland’s scope 3 travel emissions in 2004 were 18% while those of England accounted for 13% in 2015 and 9.6% in 2018.9 The share of emissions owing to pharmaceutical production ranged from 11% to 18%, and that owing to medical instruments and equipment accounted for 7%–10% of the total CF.13 14 24
The ratio of emissions by the healthcare sector to the total CF in studies focused on a single country ranged from 2.7% in China in 201215 to 9.8% in the USA in 2013.11 The three cross-national studies considered here estimated that healthcare had contributed 5.5%20 on average to the national CF in 2014 and 4.4% in 2015.22
Discussion
Interpretation of results
The results indicate that healthcare significantly contributes to the CF, both in absolute numbers and in relation to a country’s overall emissions and its per capita emissions. However, the results varied among the studies, and their calculation methods were heterogeneous and frequently not fully transparent. The breakdown of the sources of emissions revealed the major contribution made by hospitals.
The time series results showed that the trend of emissions due to healthcare was positive in all the countries considered, that is, they were increasing, except in Scotland and England. These results align with the graphical results provided by Lenzen et al.22 Furthermore, they indicated that the efforts of the British NHS systems to reduce their CF based on the Greener NHS programme was effective in reducing GHG emissions. The breakdown of the sources of emissions verified the important contribution of hospitals. However, hospitals provide the majority of medical care in many countries. Therefore, their large CF is not surprising but might motivate the relevant decision-makers to allocate scarce resources more efficiently. The breakdown further showed that a large portion of the CF of healthcare stemmed from scope 3 emissions. Decision-makers may conclude that the most considerable reduction in emissions can be obtained by considering staff and patient travel. Therefore, ‘greening’ the healthcare sector requires a sustainable transportation system and green healthcare goods.
Most data were from the Organisation for Economic Co-operation and Development (OECD) countries, China and India. The only exception was the work by Lenzen et al,22 who considered 189 countries in their analysis.22 However, even if the distribution of countries limits the representativeness of the results, the findings are consistent with the fact that OECD countries are the main emitters of GHGs.
While heterogeneity in methodology, in general, can lead to more robust results and a more informative perspective on the issue at hand, the differences in I–O methodologies to calculate the CF of healthcare may reduce the comparability of the results. However, the choice of method depends on the corresponding research question, for example, while SRIO may be more up-to date and include a more detailed description of the domestic production sectors, MRIO can account for international trade and differences in production emissions between countries.
Limitations
This review has several limitations. First, the review process used here was limited due to restrictions on the language used in the study and those related to access. Second, it is possible that further CF assessments exist which were published in the official languages of many countries in the grey literature, such as publications by national statistics offices or governmental agencies. Because this review included only publications in English and German, many such studies have likely been neglected. Third, the reporting scheme and transparency score used in this study may have limitations. Both were based only on a consensus among the authors. The instruments used to assess the quality of the published studies are typically chosen based on a broad consensus among experts, such as in the case of the Consolidated Health Economic Evaluation Reporting Standards.25 However, we did not find similar guidance for I–O analyses. Finally, the review is limited as the studies only report averages instead of CIs or data ranges. Only Malik et al16 report the 68% CI with a range of 20 748 kt CO2eq in the results (68% CI 25 398 kt CO2eq to 46 146 kt CO2eq). Therefore, the results presented in both the individual studies and in this review should not be regarded as precise measurements, but rather as indicative trends or directions.
Implications for further research
This review identified research gaps that should be investigated by future research. First, there is a need to assess the potential effects of efforts to reduce emissions on the system and pathways to a low-carbon healthcare system. Second, it should be examined errors of aggregation when using the I–O methodology in the healthcare context. Third, the differences in the outcomes when making different methodological choices (SRIO or MRIO, systemic boundaries, etc) should be analysed to guide future research.
The transparency checklist used in this study can serve as an initial reference point for future developments. For example, in the checklist’s current state, all criteria are weighted equally. However, some might be less crucial to delivering harmonised study findings. An extended consensus process with further experts is proposed to validate the checklist further and increase its value for research and practice.
Data availability statement
All data relevant to the study are included in the article or uploaded as supplementary information. Data are available upon reasonable request. The data that support the findings of this study are available in online supplemental file 4 'System description and results' and online supplemental file 5 'Methods and transparency'. Further data are available from the corresponding author (MKeil), upon reasonable request.
Ethics statements
Patient consent for publication
Ethics approval
Not applicable.
Acknowledgments
We would like to thank Frauke Waßmuth for her help in the screening and extracting phase of the search update.
Supplementary materials
Supplementary Data
This web only file has been produced by the BMJ Publishing Group from an electronic file supplied by the author(s) and has not been edited for content.
Footnotes
X @MattisKeil
Contributors MKeil (guarantor): methodology, screening, formal analysis, writing – original draft, writing – review and editing, visualisation; LF, MH, MKnieß: methodology, screening, formal analysis, writing – original draft; OL: conceptualisation, methodology, writing – review and editing; TK: methodology, writing – review and editing. WR: conceptualising, methodology, writing – review and editing, supervision, project administration. All authors have read and approved the final manuscript for publication.
Funding This work was supported by the Leibniz ScienceCampus Bremen Digital Public Health (lsc-diph.de), which is jointly funded by the Leibniz Association (W4/2018), the Federal State of Bremen, and the Leibniz Institute for Prevention Research and Epidemiology (BIPS) for OL’s inputs to the research project. The funder had no role in the study design, the collection, analysis, interpretation or submission of the data. MKeil’s inputs were supported by the research cluster 'Health City Bremen' which is funded by the Federal State of Bremen. The funder had no role in the study design, the collection, analysis, interpretation or submission of the data.
Competing interests None declared.
Patient and public involvement Patients and/or the public were not involved in the design, or conduct, or reporting, or dissemination plans of this research.
Provenance and peer review Not commissioned; externally peer reviewed.
Supplemental material This content has been supplied by the author(s). It has not been vetted by BMJ Publishing Group Limited (BMJ) and may not have been peer-reviewed. Any opinions or recommendations discussed are solely those of the author(s) and are not endorsed by BMJ. BMJ disclaims all liability and responsibility arising from any reliance placed on the content. Where the content includes any translated material, BMJ does not warrant the accuracy and reliability of the translations (including but not limited to local regulations, clinical guidelines, terminology, drug names and drug dosages), and is not responsible for any error and/or omissions arising from translation and adaptation or otherwise.