Article Text

Abstract
Objective Over 160 000 participants per year complete the 12-item Oxford Hip and Knee Scores (OHS/OKS) as part of the NHS England Patient-Reported Outcome Measures (PROMs) programme. We used a modern computational approach, known as computerised adaptive testing (CAT), to simulate individually tailored OHS and OKS assessment, with the goal of reducing the number of questions a patient must complete without compromising measurement accuracy.
Methods We fit the 2018/2019 PROMs data to an item response theory (IRT) model. We assessed IRT model assumptions alongside reliability. We used parameters from the IRT model with data from 2017/2018 to simulate CAT assessments. Two simulations were run until a prespecified SE of measurement was met (SE=0.32 and SE=0.45). We compared the number of questions required to meet each cut-off and assessed the correlation between the full-length and CAT administration.
Results We conducted IRT analysis using 40 432 OHS and 44 714 OKS observations. The OHS and OKS were both unidimensional (root mean square error of approximation 0.08 and 0.07, respectively) and marginal reliability 0.91 and 0.90. The CAT, with a precision limit of SE=0.32 and SE=0.45, required a median of four items (IQR 1) and two items (IQR 1), respectively, for the OHS, and median of four items (IQR 2) and two items (IQR 0) for the OKS. This represents a potential 82% reduction in PROM length. In the context of 160 000 yearly assessments, these methodologies could result in the omission of some 1 280 000 redundant questions per year, which equates to 40 000 hours of patient time.
Conclusion The application of IRT to the OHS and OKS produces an efficient and substantially reduced CAT. We have demonstrated a path to reduce the burden and potentially increase the compliance for these ubiquitous outcome measures without compromising measurement accuracy.
- quality in health care
- adult orthopaedics
- hip
- knee
Data availability statement
All data relevant to the study are included in the article or uploaded as supplementary information. Difficulty and discrimination parameters of the IRT model for both the OHS and OKS are available in Appendix 1. All data are available from NHS digital and can be used in accordance with the open government licence for public sector information.
This is an open access article distributed in accordance with the Creative Commons Attribution Non Commercial (CC BY-NC 4.0) license, which permits others to distribute, remix, adapt, build upon this work non-commercially, and license their derivative works on different terms, provided the original work is properly cited, appropriate credit is given, any changes made indicated, and the use is non-commercial. See: http://creativecommons.org/licenses/by-nc/4.0/.
Statistics from Altmetric.com
Strengths and limitations of this study
Our study is the first application of computerised adaptive testing on the worlds largest repository of patient-reported outcome measures.
Over 35 000 responses were used in each modelling and simulation group.
The Oxford Hip and Knee scores are very widely used at an international level.
This secondary database analysis requires validation in a prospectively collected cohort.
The available data sets are limited due to attrition that is attributed to the linking of patient-reported outcome measure data to health records.
Introduction
The ability to assess a patient’s perspective about their health is central to holistic clinical decision-making, medical research and health policy construction.1 For hip and knee replacement surgery, patients often complete questionnaires called patient-reported outcome measures (PROMs) before and after their operation. Since 2009, over 160 000 patients per year undergoing a hip or a knee replacement complete PROMs as part of the NHS England’s PROMs Programme.2
The PROMs used as part of this programme include the Oxford Hip Score (OHS) and Oxford Knee Score (OKS), which are filled in using pen and paper. Outside of the UK, they are also collected routinely as part of arthroplasty registries in Australia, New Zealand, Canada and the Netherlands.3 The completion rates across England for the 2018/2019 preoperative OHS and OKS were 85.7% and 86.1%, respectively;4 however, at the hospital trust level, the completion rate varies from 30% to 100%.5 Attrition is evident when obtaining completed postoperative PROMs (70% completion), further reduction in the data are caused by the process of transcribing the scores to a digital platform and linking with health records, which reduces the number of usable records to below 50%.4 It has been recognised that PROM questionnaires collected using paper and pen for the England PROMs programme are resource intensive, inefficient for providers and burdensome for patients.6 The time required to complete orthopaedic PROMs is seen as a key barrier by patients, and the risk of non-completion is highest in those from the most deprived quintile of socioeconomic status and those with poorer general health.5 7
PROMs are composed of a series of questions (items) that ask patients about aspects of their health. These are scored with a structured format to give an estimate of a continuous construct known as a latent trait (ie, a variable that is not directly observable).8 Latent traits in orthopaedics typically include pain and physical function. The OHS and OKS were developed using a methodological process called classical test theory (CTT), whereby fixed-length questionnaires were given an overall score, without weighting or standardisation, which estimates the latent trait. More recently, PROMs developed using advanced psychometric techniques have emerged. Influenced by state-of-the-science psychological tests, modelling approaches including Rasch analysis and item response theory (IRT) focus on the individual item within the scale, in contrast to CTT methods, which focus on the total score of all the items together.9 The ability to calibrate each item individually dramatically increases the versatility of the resulting PROM. Within the IRT paradigm, valid measurement can be obtained using any number of questions from the scale, whereas under CTT each item must be administered for the score to be deemed valid. Another limitation of CTT is that it can only identify items that are not related to the construct being measured, it does not identify items which are redundant (eg, too similar to others), and can incentivise the inclusion of these redundant items.10 The flexibility of IRT is leveraged by a computational technique known as computerised adaptive testing (CAT).11 A CAT methodology iteratively selects the most informative and relevant items for a particular individual, thereby individualising the assessment to the patient, often resulting in reducing assessment length while maintaining acceptable levels of accuracy. Importantly, IRT analyses can be retrospectively applied to legacy PROMs that were initially designed using CTT. Rasch analysis of the OHS and OKS has previously been undertaken, with all studies demonstrating improvements in precision and group discrimination.12–15 The development of OHS/OKS CAT could improve the efficiency of administration and reduce the administrative burden of the PROMs programme while offering the opportunity to implement a CAT at an unprecedented scale.
The purpose of this study is to assess whether the application of IRT and CAT to the OHS and OKS confers a reduction in questionnaire burden while maintaining precision.
Methods
Data
The OHS was developed in 1996 and the OKS in 1998.16 17 Each PROM contains 12 items that assess joint-specific symptoms over the last 4 weeks. Each item has five response options that grade the severity of symptoms and functional limitations. Developed following interviews with joint replacement patients they were found to be the best performing condition-specific instruments available in a standardised comparison of the measurement properties.18
All individual-item level preoperative OHS and OKS scores were extracted from the 2018/2019 data release for hip and knee replacements for IRT model development. A second sample for simulation of the CAT was extracted from the 2017/2018 data release.4 Raw PROMs data are released annually on the NHS digital platform following preopertive and postoperative linking, health record linking, validation and data cleaning.4
Development of the IRT model
We assessed the number of missing responses at the item level and presented them as a percentage difference. We assessed the IRT assumptions of unidimensionality, local independence and monotonicity.19 To confirm that all items measure a single underlying construct, we assessed unidimensionality using confirmatory factor analysis (CFA). Model fit for CFA was assessed through root mean square error of approximation (RMSEA) with a borderline model fit set at ≤0.08 and good fit ≤0.06, and comparative fit index (CFI) and Tucker-Lewis index (TLI) with borderline model fit set to >0.90 and good fit >0.95 (R package ‘lavaan’ V.0.5–23.1097).20 We confirmed the dimensional structure of each scale using Mokken scaling and assessed scalability (monotonicity) of the items. This assesses whether the probability of scoring the item along its scale of symptom severity increases with a higher level of the underlying construct. A Loevinger’s H value of ≥0.3 per item was deemed acceptable (R package ‘mokken’ V.2.8.4).21
Assessment of local independence of items was undertaken to ensure that all items only relate to the dominant construct being measured, and not to a further independent construct. This was assessed by examining the residual covariance between item responses. A high residual covariance may indicate that items are unintentionally measuring another construct, or that they are very similar to each other and potentially redundant. This was undertaken through an examination of the CFA residual correlation matrix with the Yen’s Q3 statistic cut-off set to a correlation between two items of above 0.2 demonstrating locally dependent items.22
Following confirmation of the IRT model fit assumptions, a graded response model (GRM), which is appropriate when item responses can be categorised as ordered categorical,23 was fit to the item response data (R package ‘mirt’ V.3.3.2). This model yields two-item parameters, the item difficulty (a) which is a representation of the level of information about the underlying construct each item provides, and the discrimination (b) thresholds, which locate the response categories and their transitions along a contiguous scale. If the item-characteristic curves revealed disordered thresholds, where the response category does not accord with the latent trait score, reordering of adjacent response options was undertaken. Item and model fit was assessed using the RMSEA, TLI, CFI and standardised root mean square residual (SRMSR). Reliability in the IRT model was estimated as marginal reliability where the overall reliability of the test was based on the average conditional SEs.24 This overall index of precision can be compared with the classical internal consistency (Cronbach’s alpha) reliability estimate for CTT, where scores >0.8 indicate excellent reliability.
CAT simulation
The production of item thresholds and difficulty information from the IRT models allows the construction of a CAT. The administration of a CAT uses algorithms, which match participants to the most informative items within a PROM and once an acceptable level of precision is reached, denoted by the reliability (SE), of the latent trait estimate, no further items are required.25 Within a CAT simulation, the estimate of the latent trait from the full-length PROM can be compared with the delivery of shortened versions where particular items are selected. This simulation can provide information on the number of items needed to provide estimates of the latent trait at predetermined levels of precision. Through the simulation, the items that provide the highest level of information, and thereby the greatest utility in shortened versions, can be determined.
We performed a CAT simulation using Firestar for R (V.1.3.2).26 Two separate simulations were conducted for OHS and OKS with the 2017/2018 data set with predetermined stopping criteria (precision) denoted as an SE of the latent trait estimate of <0.32 and <0.45. These SE values are equivalent to a reliability coefficient of 0.90 and 0.80, respectively. Variables derived from the simulation include the correlation (intraclass correlation coefficient (ICC)) between the latent trait estimation of the full-length questionnaire and the CAT, and the mean and SD, median and IQR items required to derive estimates of the latent trait at the two levels of precision. The items selected by the CAT were reported by their percentage of use within the simulation. Differences in the item use between full-length and CAT administration are presented as a percentage difference. Time saving between full-length and CAT administration was calculated against the estimate that each item takes between 10 s and 75 s per item to complete, a time extrapolated from published reports of total completion time of 2 min to 15 min for the 12-item questionnaire.27
All data analyses were conducted in R (RStudio Team (2020). RStudio: Integrated Development for R. RStudio, PBC, Boston, Massachusetts).
Public and patient involvement
Formal patient and public involvement was not undertaken for this analysis of public domain data. The national PROMs programme, and the data held within, have been evaluated via public consultation. Response to this evaluation from a multiple stakeholders taskforce highlighted the need to improve efficiency of data collection.6
Data availability statement
Difficulty and discrimination parameters of the IRT model for both the OHS and OKS are available in online supplemental appendix 1. All data are available from NHS digital and can be used in accordance with the open government licence for public sector information.
Supplemental material
Results
Data set characteristics
Of the 40 172 preoperative OHS scores and 44 264 OKS scores in the 2018/2019 data, 1704 were revision hip replacements and 1162 revision knee replacements, which were excluded. Further exclusion of incomplete questionnaires resulted in 37 995 OHS and 42 558 OKS observations. Missing responses to items were found 4118 (0.90%) and 4803 (0.93%) times for the OHS and OKS. Although the first two items had few missing responses (0.15% OHS, 0.10% OKS), the remaining 10 had substantially more (1.04% OHS and 1.1% OKS), indicating a possible patient preference for shorter measures.
For hip replacements, 59.4% were undertaken in women, 93.8% were ≥50 years and 51.9% were ≥70 years old. 14.8% of respondents had assistance completing the questionnaires, median symptom duration was 1 to 5 years. For knee replacements, 56.5% were undertaken in women, 97.4% were ≥50 years and 51.8% were ≥70 years old. 14.6% had assistance completing their questionnaires, median symptom duration was 1 to 5 years. All demographic features of the PROMS data set were equivalent to that of the full National Joint Registry.
IRT model assumptions
The criterion of unidimensionality was met at a borderline level for both OHS and OKS with an RMSEA of 0.08 (OHS) and 0.07 (OKS), CFI of 0.93 (OHS) and 0.94 (OKS), TFI of 0.91 (OHS) and 0.93 (OKS). Mokken scaling corroborated this finding of unidimensionality and produced overall scalability coefficients (H) of 0.49 (range 0.41–0.58) (OHS) and 0.46 (0.38–0.55) (OKS). Local independence of items was confirmed for both OHS and OKS with all item correlations below 0.02. There were no misfitting items within the GRM model.
Following production of the IRT item characteristic curves disordered thresholds (where the curve lies under the line created by an adjacent curve) were noted in items 5, 6, 9, 10 and 12 for the OHS and items 4, 6 and 8 for the OKS. Items with disordered thresholds were rescored, giving them the same score as the adjacent item whose area it lays within (figure 1A, B). Item-level RMSEA was good for both scores with all items RMSEA <0.02 (online supplemental appendix 1). The marginal reliability of the model was 0.91 for OHS and 0.90 for OKS. Overall model fit was boarderline for the OHS (RMSEA 0.09, SRMSR 0.05, TLI 0.82 and CFI 0.90) and borderline to good for OKS (RMSEA 0.06, SRMSR 0.04, TLI 0.91 and CFI 0.94).

Item Response theory (IRT) item traces for the 12 items of the Oxford Hip Score (OHS) (A) and Oxford Knee Score (OKS) (B).
CAT simulation
We conducted a CAT simulation using the derived IRT parameters and using the preoperative OHS and OKS item responses from the 2017/2018 data release as the testing set. For the OHS 36 516 participants, scores were included, and for the OKS 45 122. Incomplete records (ie, less than 12 item scores) were included as the IRT method accounts for missing data, using all available responses to gain the best estimate of the latent trait. At the SE threshold of 0.32 (corresponding to a reliability of 0.9), the ICC between full-length and CAT latent trait estimates was r=0.96 (OHS) and r=0.96 (OKS) (figure 2). For the OHS CAT, the mean number of items required was 3.98 (SD 1.26) with a median of 4 (IQR 1). For the OKS CAT, the mean number of items required was 4.22 (SD 1.32) with a median of 4 (IQR 2) (figure 3).

Scatter plot and correlation between the theta estimation (values of the latent trait) between the full 12-item administration and the computerised adaptive test (CAT) for the Oxford His Score (OHS) (A and B) and Oxford Knee Score (OKS) (C and D) at 0.32 SE and 0.45 SE.

Bar chart showing the number of items used per participant at 0.32 SE and 0.45 SE for the OHS (A, B) and OKS (C, D) computerised adaptive test (CAT).
With a precision SE threshold of 0.45 (corresponding to a reliability of 0.8), the concordance between full-length and CAT simulations decreased marginally to r=0.90 (OHS) and r=0.91 (OKS) (figure 2). The OHS CAT required a mean of 2.27 (SD 0.45) items, median of 2 (IQR 1). The OKS CAT required 2.13 (SD 0.45) items, median of 2 (IQR 0) (figure 3).
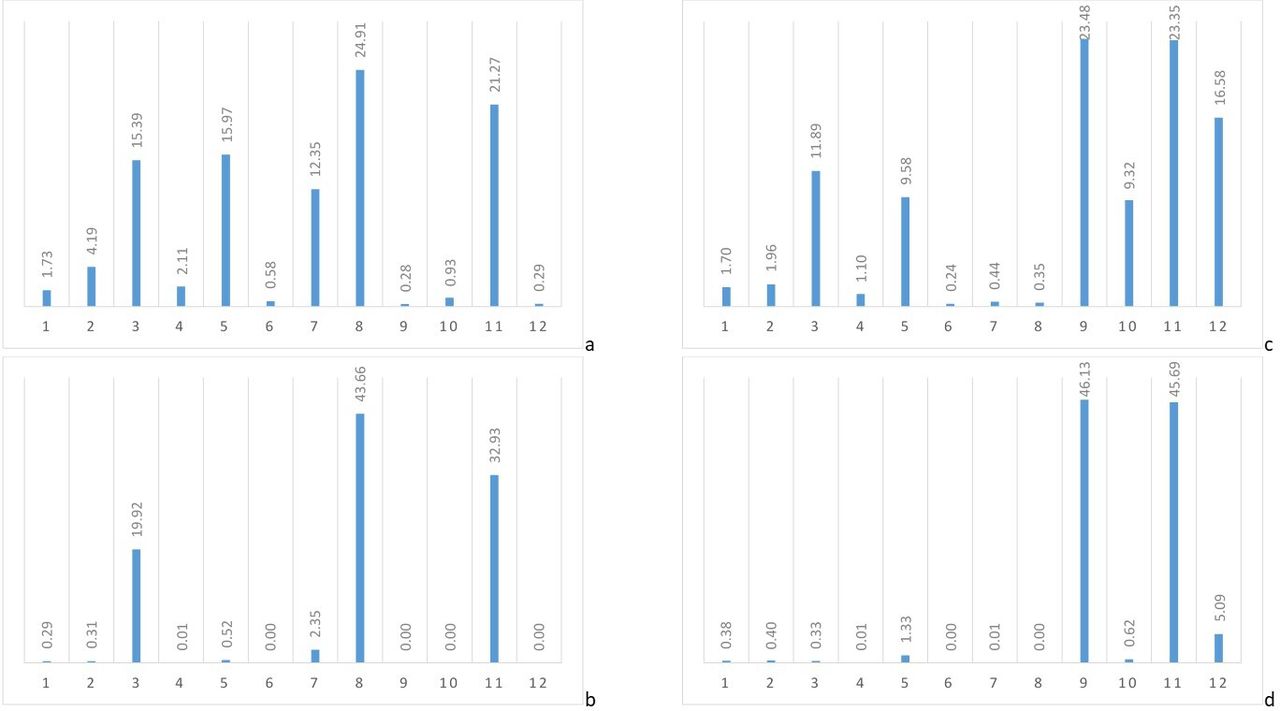
For the OHS, the simulation selected item 8 as the starting item for all participants, unless item 8 was not scored. For the OKS, item 9 was used as the staring item. Overall, when all items are collated, the items used most frequently within the 0.35 SE CAT were items 8 (24.9%) and 11 (21.3%) for OHS, and items 9 (23.5%), 11 (23.4%) and 12 (16.5%) for the OKS, all other items were used less than 16% of the time. At 0.45 SE, OHS items 3 (19.9%), 8 (43.7%) and 11 (32.9.0%) were used most frequently within the simulations, four items were not used in any simulations, and all other items were used less than 3% of the time. For the OKS items, 9 (46.1%) and 11 (45.7.0%) were used most frequently, item 12 (5.1%) was minimally used leaving two items that were not required in any simulations (including, among them, items 6 and 8 whose response options had been identified as disordered) and all others were used in less than 1.4% of simulations (figure 4)(online supplemental appendix 1).

Bar chart showing the proportional use of each item at 0.35 SE and 0.45 SE for the OHS (A, B) and OKS (C, D) computerised adaptive test (CAT).
The items used most frequently in estimating the level of the latent trait, and selected as the starting item within the simulations, were item 8 for the OHS (During the past 4 weeks… After a meal (sat at a table), how painful has it been for you to stand up from a chair because of your hip?) and within the OKS were item 9 (During the past 4 weeks… How much has pain from your knee interfered with your usual work (including housework)?). Item 11 was also consistently used as the second item for the OKS simulations (During the past 4 weeks… Could you do the household shopping on your own?).
Out of a potential 438 192 items for the OHS scores, only 145 462 items were used by the CAT at 0.32 SE, and 82 980 at 0.45 SE. This represents a 100.3% and 136.3% difference. Taking the whole 2018/2019 NJR data set before exclusions of 95 977 total hip replacements, at 0.45 SE, this represents a potential time saving of 2583–19 374 hours for preoperative scores. Out of a potential 541 464 items for the OKS scores, only 190 410 items were used by the CAT at 0.32 SE, and 96 922 at 0.45 SE, representing a 100.3% and 136.3% difference. For the entire NJR data set in 2018/2019, at 0.45 SE, this represents a potential saving of between 2832.2 and 21 241.5 hours for collection of preoperative scores.
Discussion
The use of PROMs in the outcome assessment of hip and knee replacements is widely accepted. The best PROMs for patients, researchers and clinicians are easy to understand, free from redundancy and psychometrically robust. In this study, we have applied a modern psychometric approach to one of the world’s largest repositories of orthopaedic arthroplasty PROMs. The OHS and OKS conformed to IRT assumptions by demonstrating unidimensionality, monotonicity and local independence. CAT simulations demonstrated the possibility to dramatically reduce the length of these 12-item PROMs to as little as two items at a high level of precision. In large-scale data collection, the potential time saving from the deployment of a CAT is equivalent to more than a million redundant questionnaire items per year and more than 4 years of collective patient time annually.
Although Rasch analysis, a type of IRT methodology, has previously been applied to both the OHS and OKS,13 15 no research to date has explored the possibility of using these methods to reduce the burden of assessment using CAT. CAT achieved the goal of minimising the burden of a PROM by only delivering the most relevant and informative items required to measure a patient’s level of hip or knee pain and function.28 The simulations performed within this study were able to reduce the number of items required by 67% for the OHS and 65% for the OKS at 0.32 SE (equivalent to 90% precision) and as much as 81% for both PROMs at 0.45 SE (80% precision). As a comparator, the reliability (taken as a proxy marker of precision) of the 12-item OHS and OKS delivered (using the CTT-derived scoring system) has a test–retest ICC of 0.82–0.94.29 30 Although this is excellent, delivery of the full test does not demonstrate superiority over a CAT administration. A minimal reliability threshold of 0.70 is commonly accepted for PROMs, such as those used in the NHS England PROMS programme. The SE at this reliability level is 0.55 of an SD, which is roughly equivalent to a reliability of 0.70.31 Similarly, an SE of 0.45 (equivalent to 0.80 reliability), in this simulation, a median of only two items was required to estimate patients’ pain and function, dramatically reducing the burden on a patient. Interestingly, although the overall completion rate of the PROMs was high, within this sample, the non-completion of items substantially increased after the first two items, and then remained stable for the remaining 10 items. Whether this is related to the item structure or order, or indeed whether this is related to the mode in which the OHS and OKS are delivered as part of the National PROMs programme, is uncertain. The OHS and OKS are asked as part of a battery of tests within the National PROMs programme, overall 27 questions are asked within an eight-page booklet. Beyond the OHS and OKS, the questions include the three-level EuroQOL 5-Dimension PROM, comorbidity profiles, surgical history, symptom duration and demographic profiles. Within this questionairre, some repetition exists, and the non-completion or partial completion may relate to the size of this data set. Minimising respondent fatigue by simply asking two items is likely to improve completion rates both at the start of data collection and longitudinally, thereby optimising the utility of this valuable data.32 The value and reliability of PROMs are vastly improved by regular administration over time, the ability to conduct this with targeted highly condensed PROMs that retain their ability to precisely estimate the latent trait is only possible through IRT analysis and CAT administration.25 Furthermore, the two items used most frequently in the CAT deployment for OHS (items 8 and 11), have been judged by patients as having the most clarity and fewest limitations.33 Of interest, within both PROMs, the preoperative items pertaining to function, rather than pain, were selected by the simulation as most valuable.
The use of IRT-derived PROMs is becoming increasingly prevalent in efforts to advance high-value care and improve shared decision-making.34 The ability to score on a simple continuum (eg, 0–100) and derive population norms (eg, a score of 50) vastly improves patient comprehension of their score. Patients’ understanding of the relevance of their PROM score improves their compliance with future assessment and optimises the use of a PROM as a decision aid.35 The use of this latent trait continuum that is independent of the PROM also allows comparison of the OHS and OKS scores with other scores assessing the same trait. Therefore, so-called ‘cross-walks’ can be derived to compare the scores derived from the OHS and OKS with other hip scores such as the Hip disability and Knee injury and Osteoarthritis Outcome Scores that have also undergone IRT analysis,36 or contemporarily designed PROMs such as the PROMIS physical function and pain interference scores. This attribute can have a profound effect on the translatability of research findings. Finally, IRT-level analysis also opens up future assessment of differential item functioning. Here, an exploration of the extent to the item may be measuring different abilities dependent on variables such as age, gender, comorbidity profile or operation type could be undertaken.
The authors recognise limitations inherent to this study. We recognise that the dimensionality of both the OHS and OKS could be contested on the basis of the borderline results. It has previously been identified that both one-factor and two-factor models fit these scores.37 38 As the most commonly applied scoring method uses the total score for this very common PROM, it was deemed appropriate to maintain a unidimensional model. The authors do recognise that by proposing an alternative method of scoring, there is a risk of loosing legacy knowledge relating to the Oxford scores, to ameliorate this risk, we would recommend the provision of a conversion matrix to allow the presentation of IRT and CTT-based scoring. We also recognise that the IRT parameters were derived on preoperative data, and, therefore, further analysis of postoperative data would be required, of particular importance would be an assessment ceiling effect under this revised scoring metric. We would recommend using the IRT-deried parameters and the availability of the full question bank in the postoperative population, rather than a specifically reduced short-form version. To improve the interpritability of the score, we would also recommend IRT-derived minimal important difference calculation for the OHS and OKS. By contextualising the differences in score that would be deemed relevant to patients, this would inform the utility of this method in trial design and as a potential adjunct to communication and decision-making. The strength of this analysis is the very large sample size for the IRT model construction. The CAT simulation requires validation on patients with both qualitative and quantitative analysis of validity and acceptability. The significant limitation to the practical application of IRT and CAT is the availability of a computer and an appropriate interface, and we recognise that currently this national programme collects this data through pen and paper completion and postal communication. However, the utilisation of the PROMIS system in the USA highlights that these barriers can be overcome; furthermore, the increasing ubiquity of tablet and smartphone interfaces and the often-underappreciated technological literacy of this patient population suggest that this problem is far from insurmountable. Both during and in the postpandemic era, remote medicine is becoming the norm; refined PROMs collection has a vital role to play in this process.
Conclusion
The collection of hip and knee outcome measures for the NHS England National PROMs program has been criticised as remote from patient care. By applying modern psychometric analysis to the world’s largest repository of hip and knee patients PROMs, we have demonstrated up to an 80% reduction in the number of items required to estimate the patient-specific impact of joint disease without compromising precision. Widespread adoption of this system has the potential to reduce participant burden and increase completion rates, thereby maximising the reliability and utility of longitudinal data.
Data availability statement
All data relevant to the study are included in the article or uploaded as supplementary information. Difficulty and discrimination parameters of the IRT model for both the OHS and OKS are available in Appendix 1. All data are available from NHS digital and can be used in accordance with the open government licence for public sector information.
Ethics statements
Patient consent for publication
Ethics approval
Formal ethics approval was not required. All data used in accordance with the open government licence for public sector information. The National Archives. Open Government Licence for public sector information. 2020. http://www.nationalarchives.gov.uk/doc/open-government-licence/version/3/ (accessed December 21, 2020).
References
Supplementary materials
Supplementary Data
This web only file has been produced by the BMJ Publishing Group from an electronic file supplied by the author(s) and has not been edited for content.
Footnotes
Contributors JPE, CG and JMV devised the project. JPE managed the data and analysed the results with oversight from CG and JMV. ADT contributed to the data management and interpretation. JPE wrote the manuscript and is guarantor. CG, ADT and JMV edited the manuscript. All authors read and approved the final manuscript.
Funding JPE is in receipt of an NIHR Academic Clinical Lecturer award. The views expressed are those of the authors and not necessarily those of the NHS, the NIHR or the Department of Health and Social Care. There was no involvement of the funder in study design, data collection, data analysis, manuscript preparation or publication decisions. All authors had complete access to the study data that support the publication.
Competing interests None declared.
Patient and public involvement Patients and/or the public were not involved in the design, or conduct, or reporting, or dissemination plans of this research.
Provenance and peer review Not commissioned; externally peer reviewed.
Supplemental material This content has been supplied by the author(s). It has not been vetted by BMJ Publishing Group Limited (BMJ) and may not have been peer-reviewed. Any opinions or recommendations discussed are solely those of the author(s) and are not endorsed by BMJ. BMJ disclaims all liability and responsibility arising from any reliance placed on the content. Where the content includes any translated material, BMJ does not warrant the accuracy and reliability of the translations (including but not limited to local regulations, clinical guidelines, terminology, drug names and drug dosages), and is not responsible for any error and/or omissions arising from translation and adaptation or otherwise.